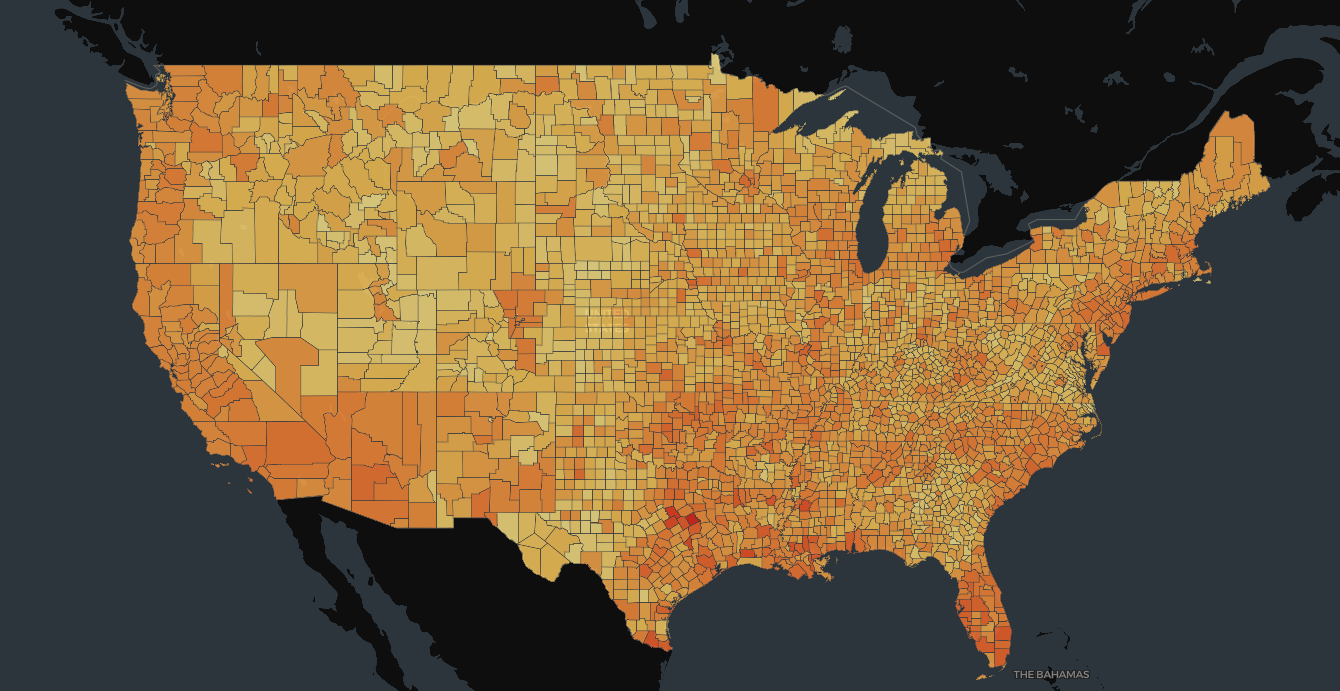
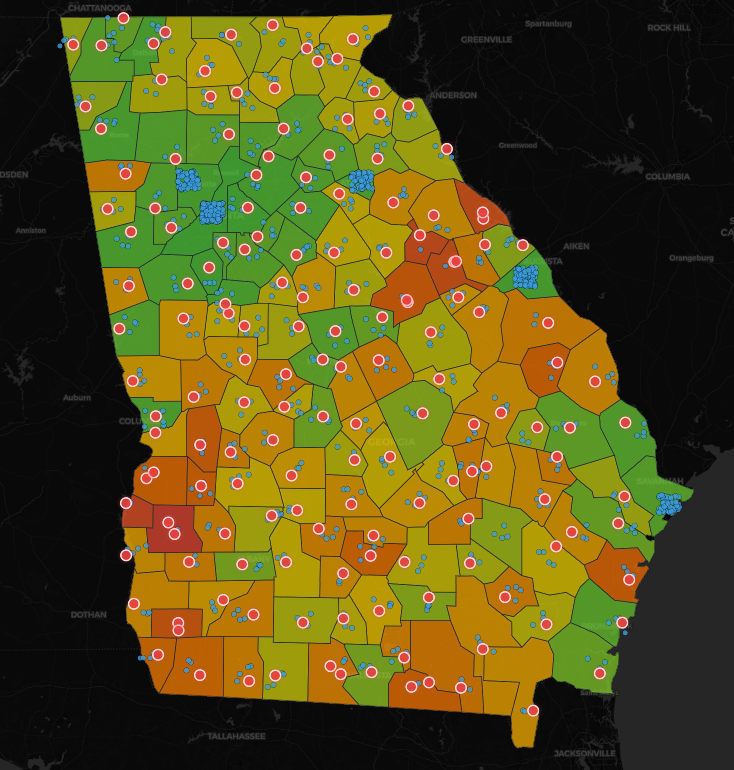
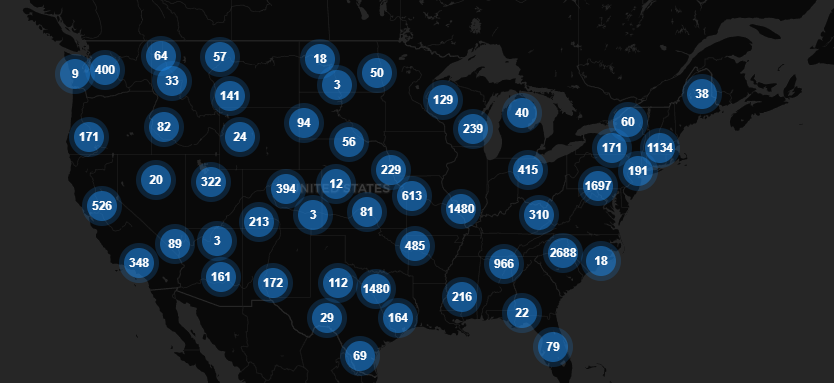
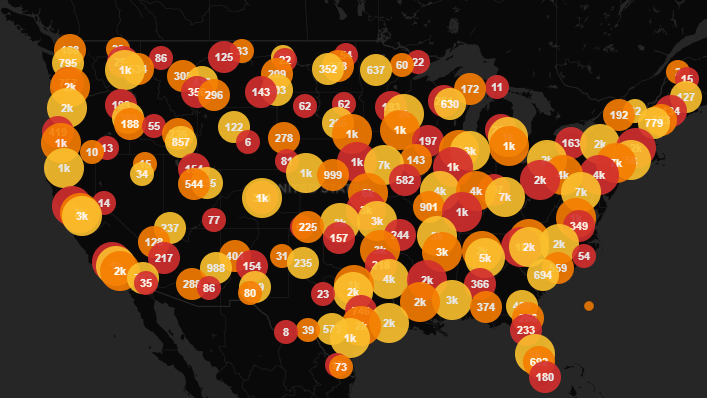
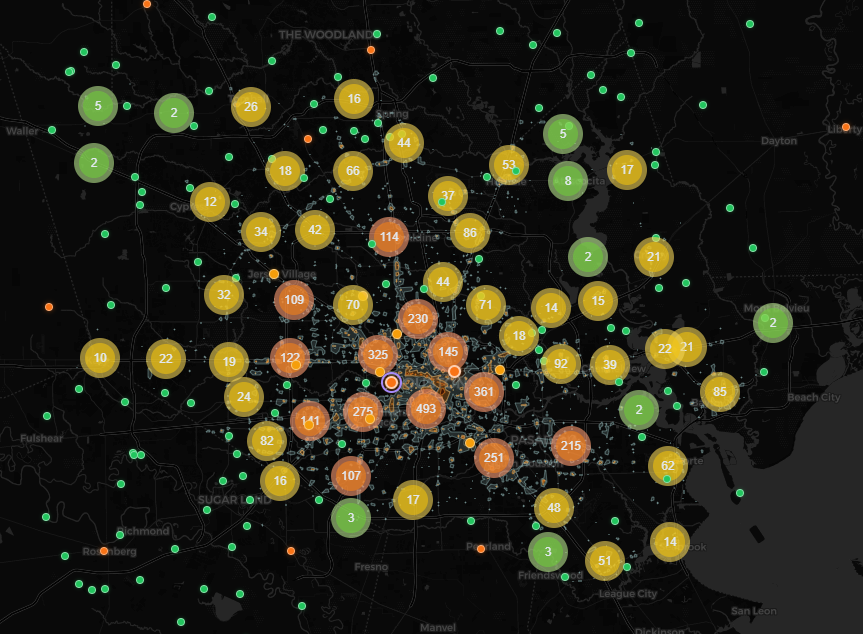
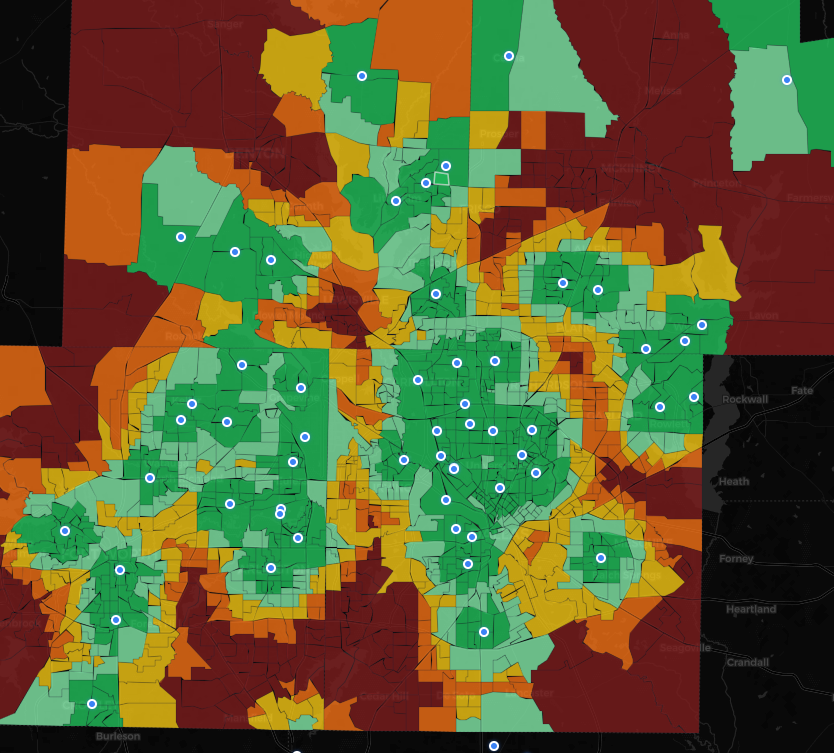
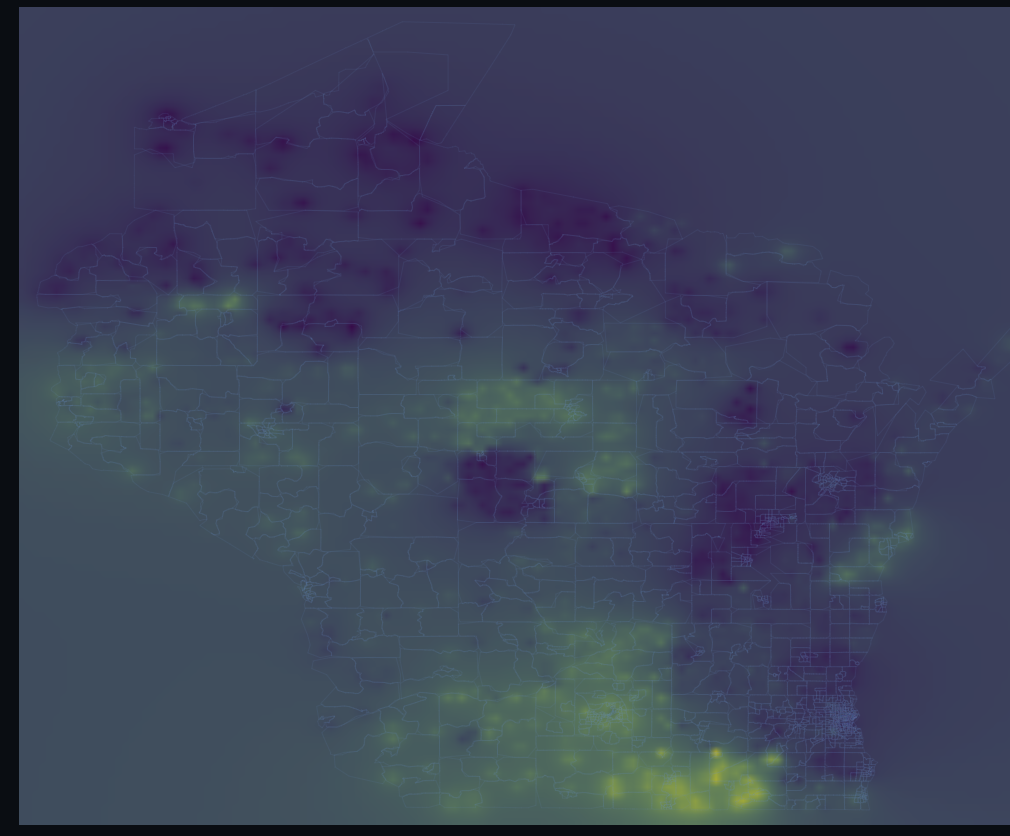
Nationwide composite risk model across all 3,144 US counties, combining grid reliability metrics, weather hazard exposure, elderly population share, and poverty rate into a single weighted vulnerability index.
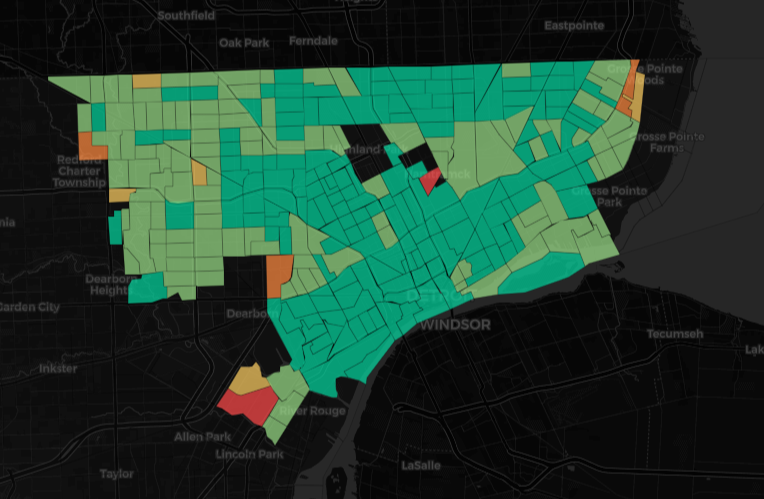
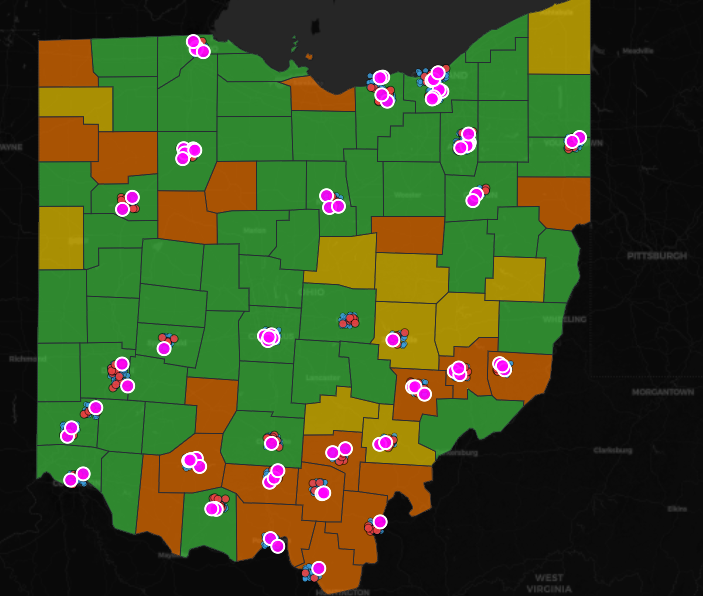
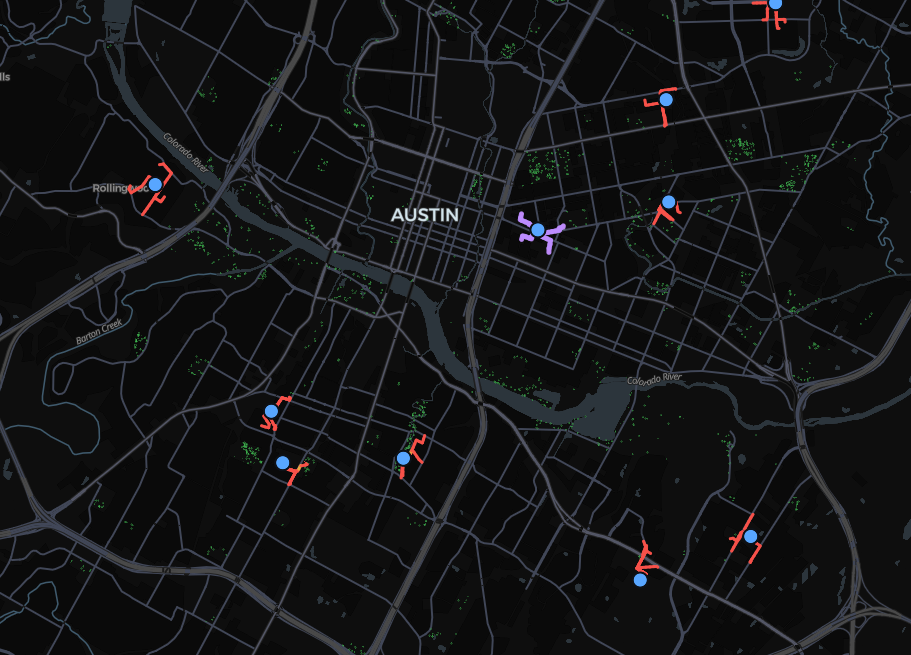
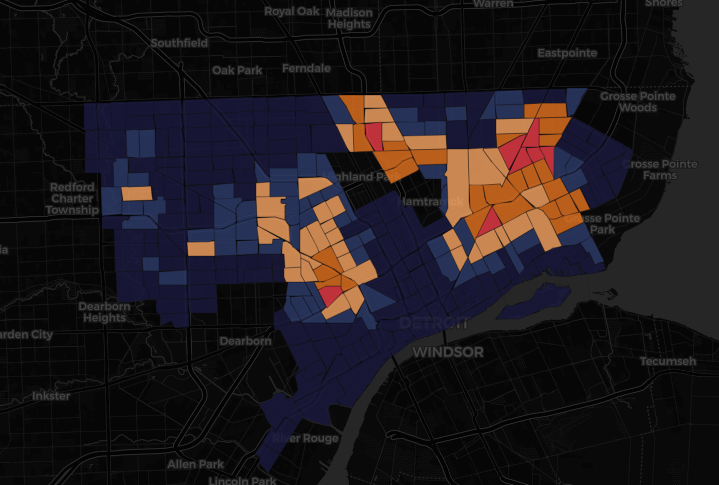
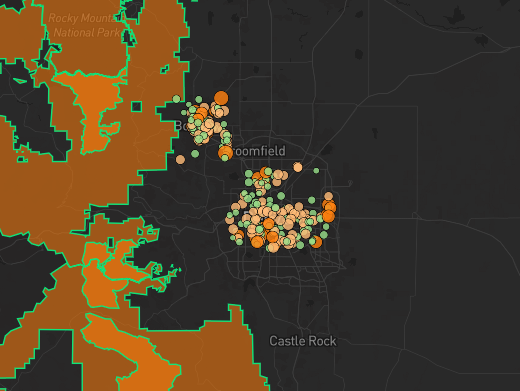
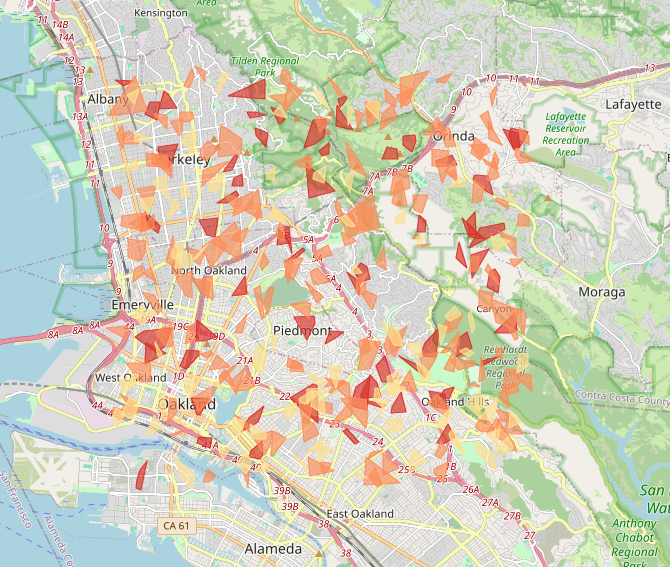
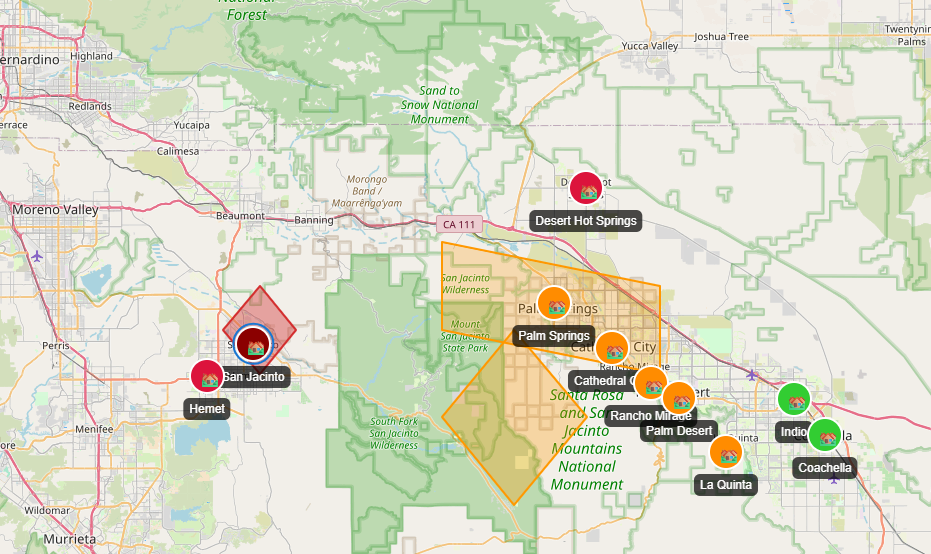
Spatial regression analysis testing whether police response times in Detroit correlate with neighborhood race and income, mapping the geography of delayed emergency response across 139 census tracts.
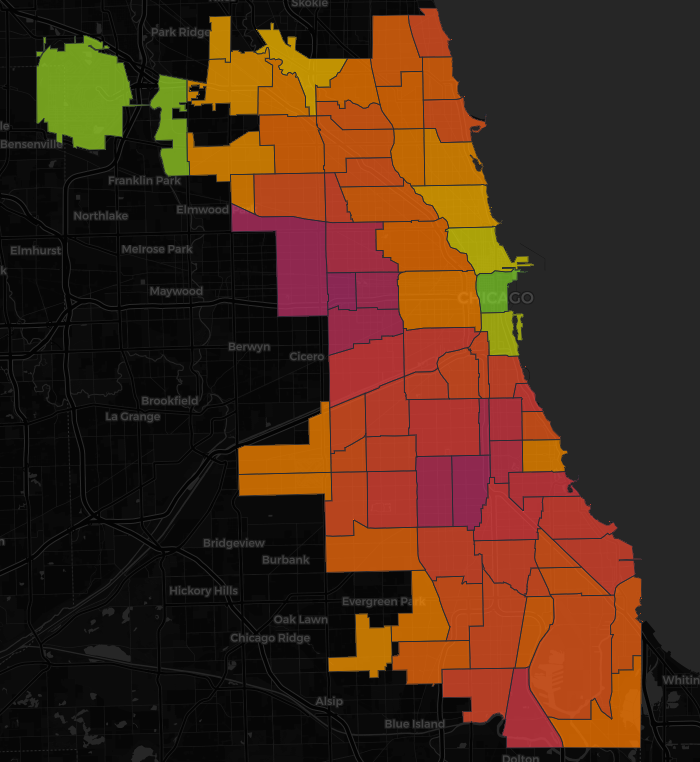
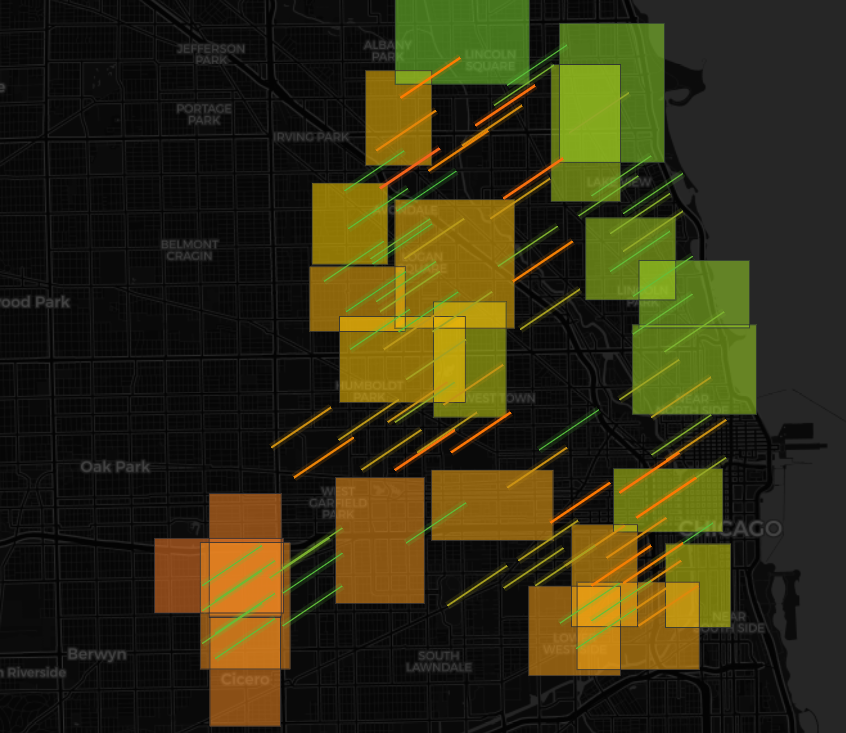
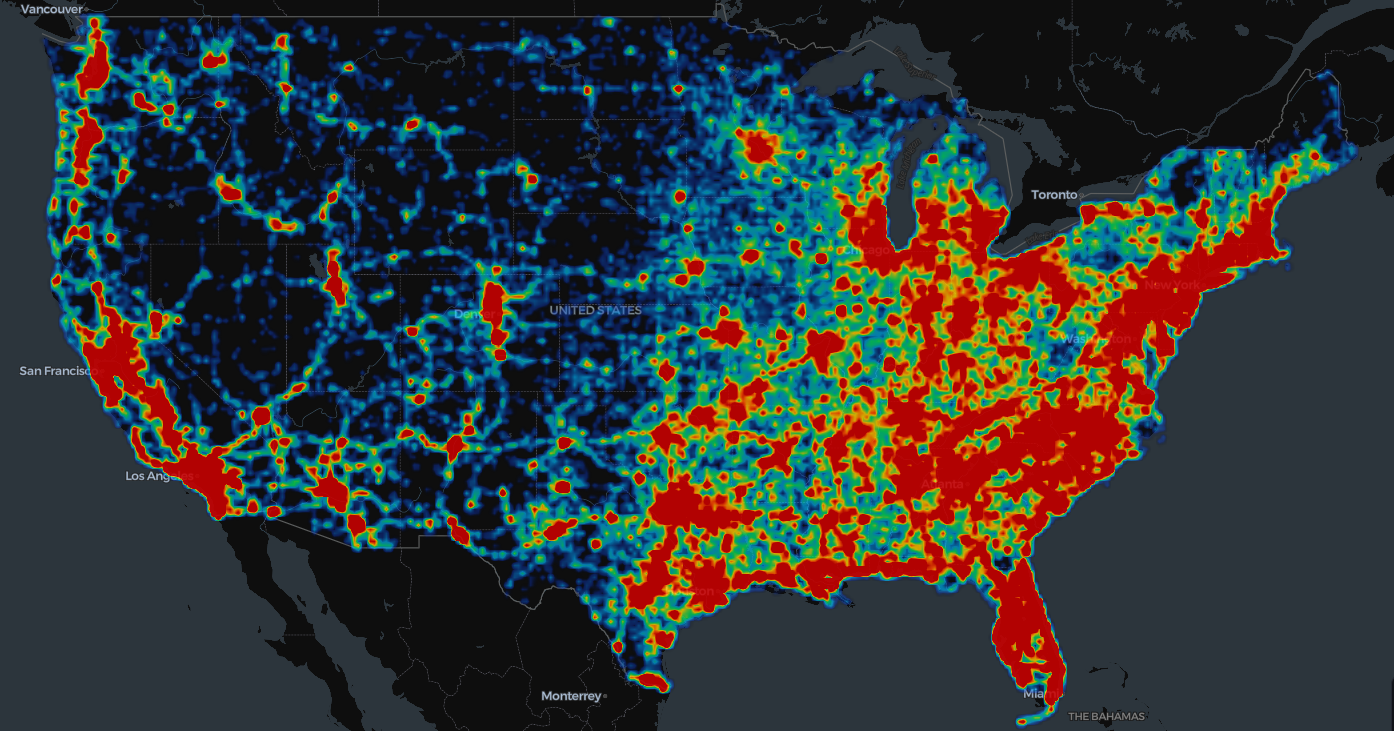
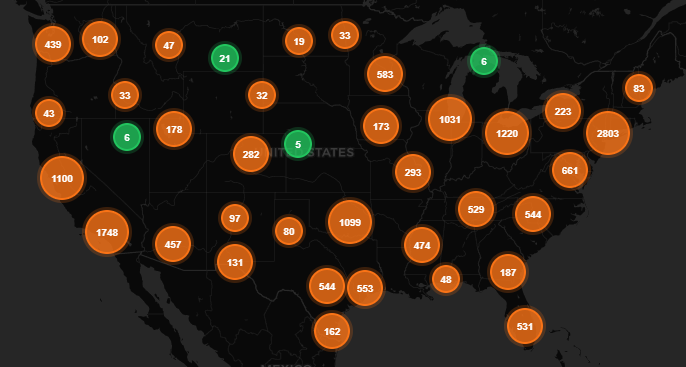
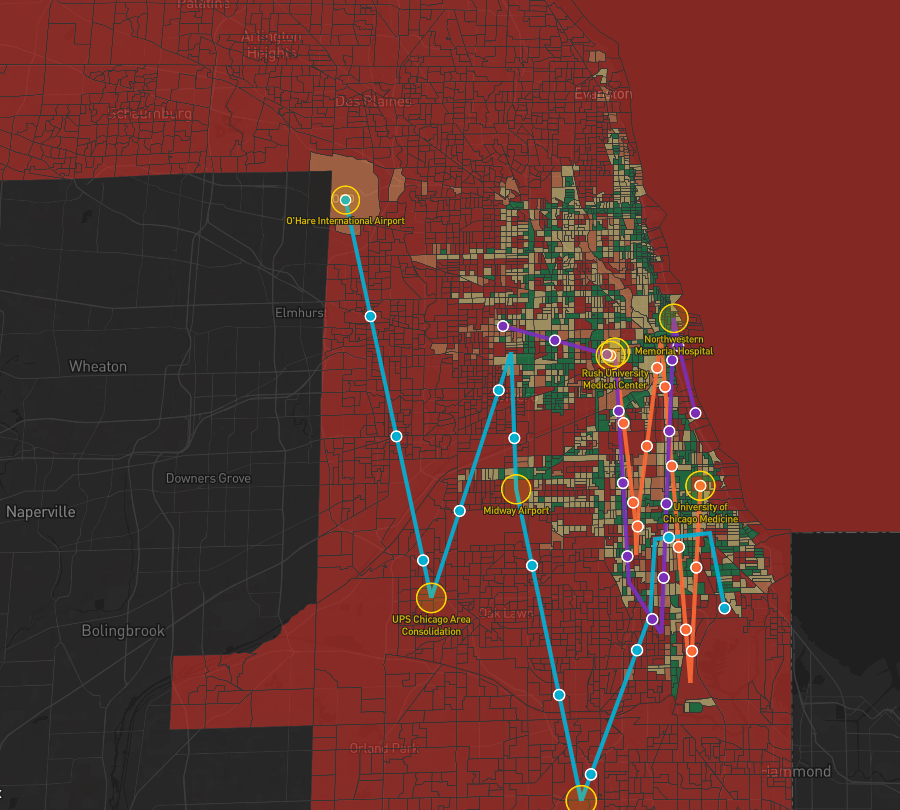
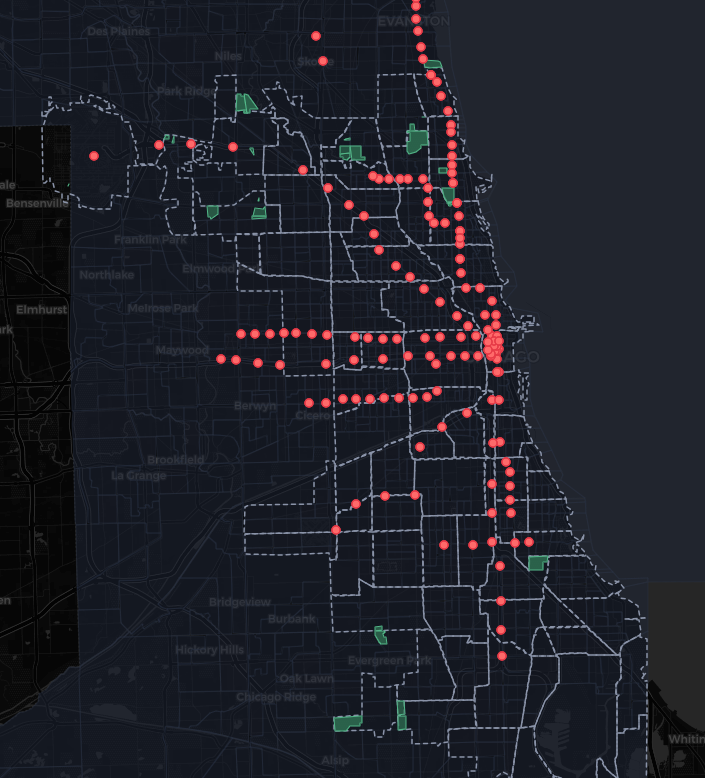
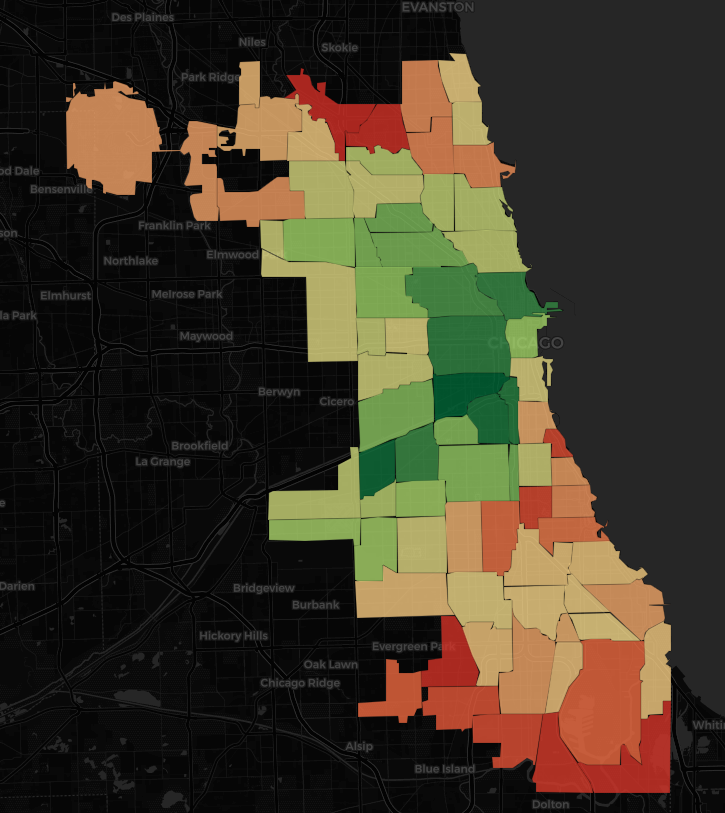
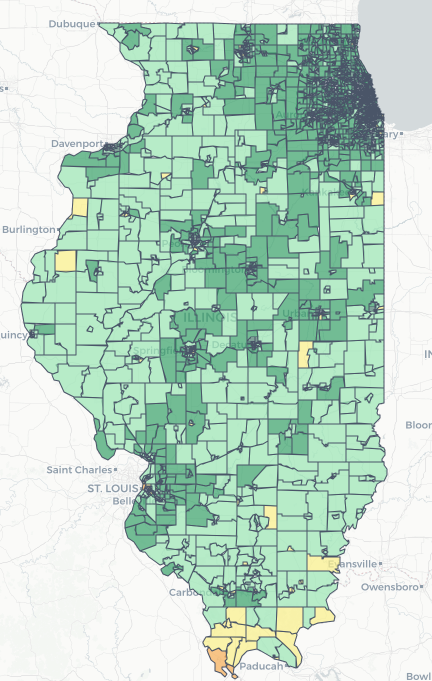
XGBoost classification model predicting which of Chicago’s ~800,000 unverified properties are likely connected by a lead service line, using Cook County Assessor records to prioritize infrastructure replacement.
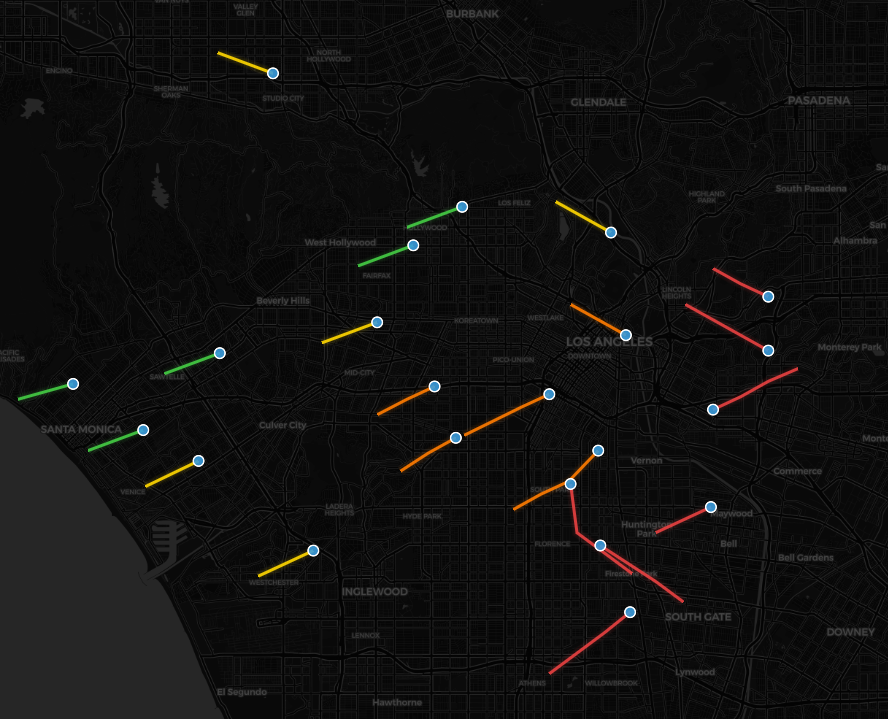
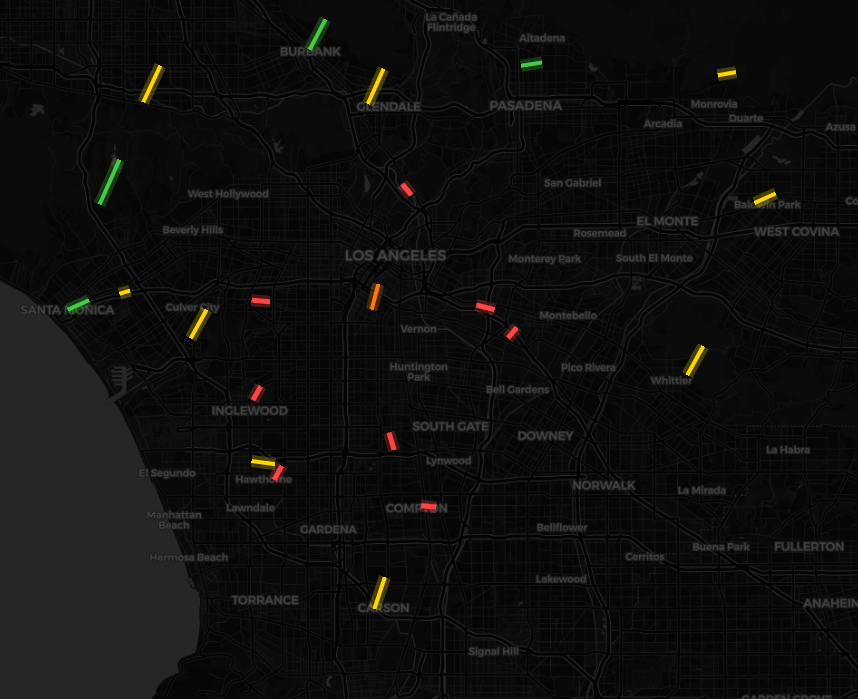
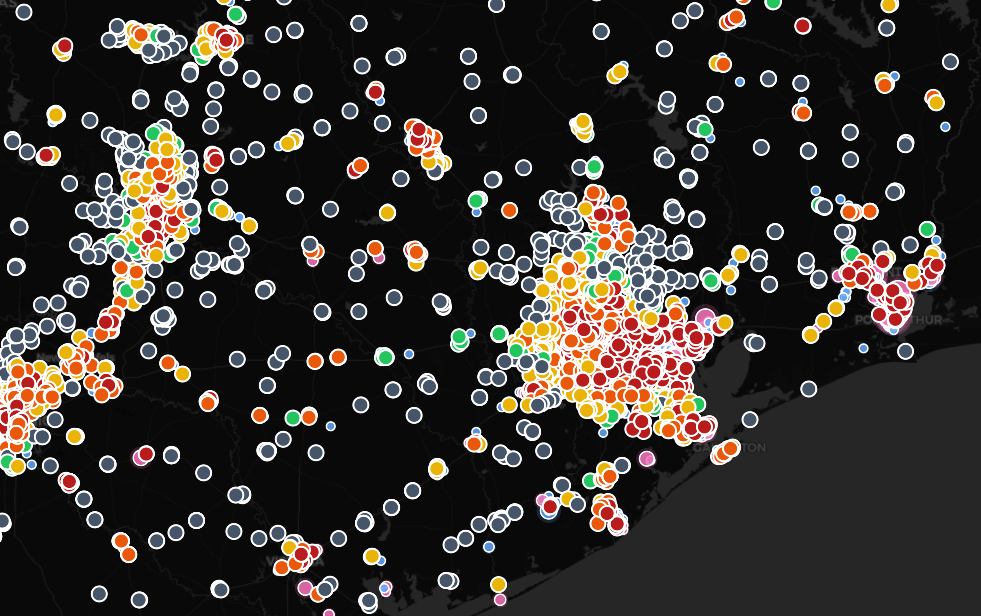
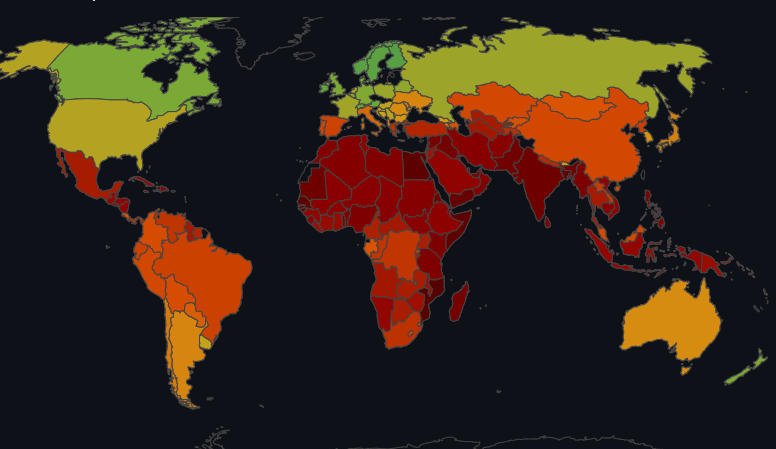
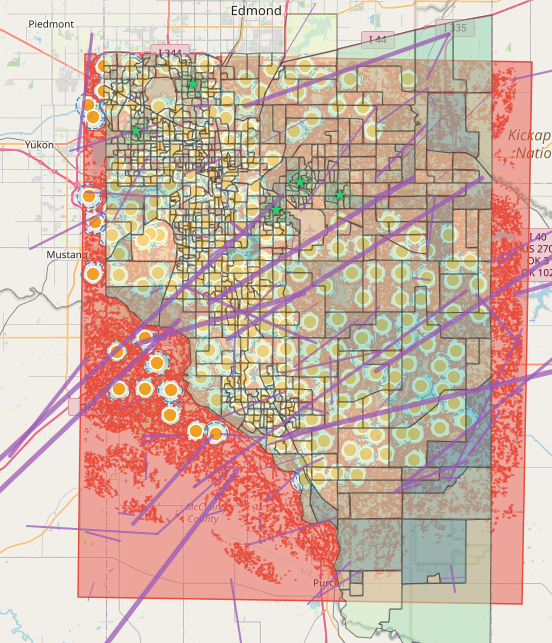
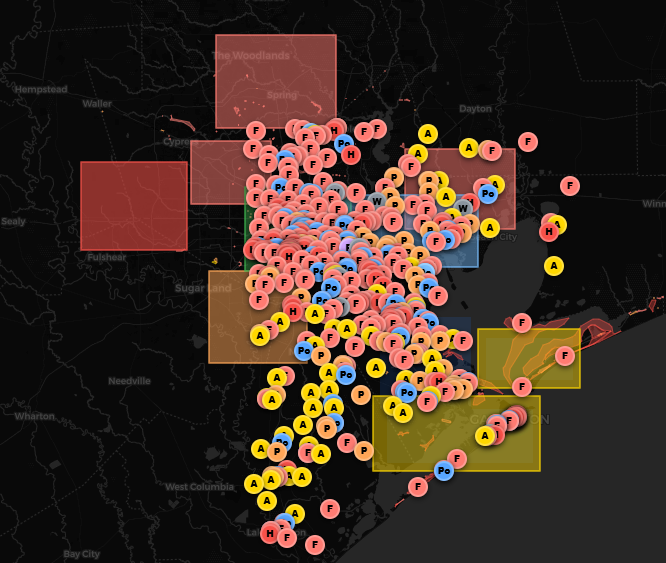
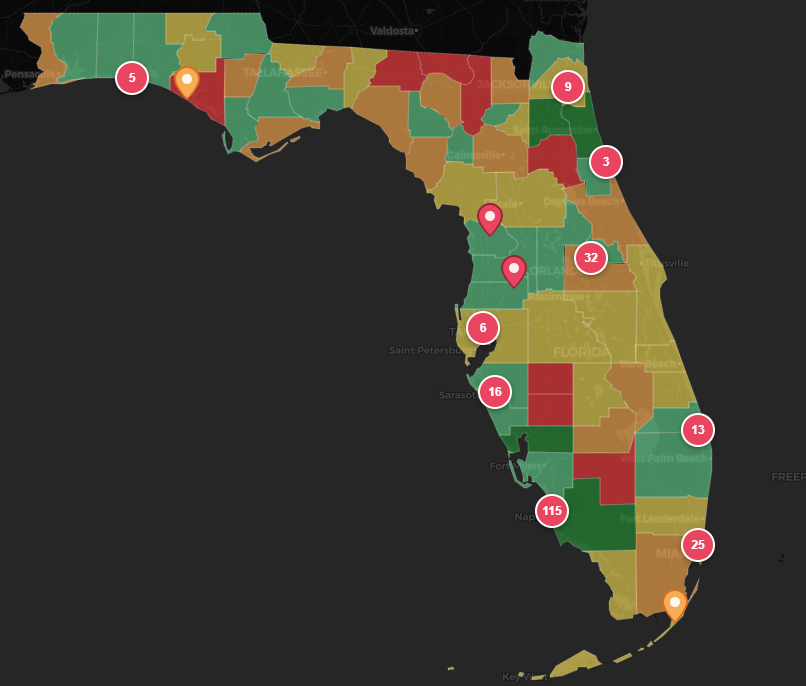
Air quality exposure analysis across 25 LA school bus routes measuring PM2.5 and NO2 at 100m intervals, revealing students in low-income neighborhoods breathe 2.4x more polluted air on their way to school.
Interactive space situational awareness dashboard tracking orbital debris and active satellites in real-time, visualizing collision risks across congested altitude bands and monitoring Kessler Syndrome cascade risk using SGP4/SDP4 orbital propagation.
Data: CelesTrak, USSPACECOM TLE feeds · Method: SGP4/SDP4 propagation, 200 km altitude binning, conjunction analysis · Stack: D3-geo, WebGL, satellite.js
View project
Interactive reconstruction of Gulf of Mexico basin formation over the past 200 million years, visualizing plate motion, spreading rates, subsidence modeling, and paleo-water depth analysis using the Müller et al. (2019) community plate model.
Data: Müller et al. (2019) plate model · Method: GPlates kinematic reconstruction, subsidence modeling · Stack: GPlates 2.4, pyGPlates, Leaflet, Plotly
View project
Interactive spatiotemporal analysis of the 2019 Ridgecrest M7.1 earthquake sequence, visualizing ~50 km of previously unmapped fault strands activated in the Eastern California Shear Zone with live USGS data and seismogenic zone filtering.
Data: USGS ComCat API, FDSN API · Method: Spatiotemporal sequence analysis, fault strand mapping · Stack: Python, Leaflet, Plotly
View project
Real-time global earthquake monitoring dashboard with depth-based coloring, magnitude-scaled markers, 24-hour event counts, and magnitude distribution charts — auto-refreshing every five minutes from the USGS Earthquake Hazards Program API.
Data: USGS Earthquake Hazards Program API · Method: Real-time feed parsing, depth/magnitude classification · Stack: Leaflet, Plotly, JavaScript
View project
Interactive analysis of racial demographic disparities across Chicago Public Schools attendance zones using the Boundary Segregation Index, integrating NCES, CPS, Census 2020, and Illinois ISBE data.
Data: NCES SABINS, CPS, Census 2020, Illinois ISBE · Method: Boundary Segregation Index · Stack: Leaflet
View project
Examines whether LA highway noise barriers deliver their promised noise reduction and whether placement reflects demographic equity — finding a 2.4x disparity in barrier protection rates and a 1.7 dB average performance gap.
Data: FHWA noise barrier data, Census ACS, USDOT · Method: Acoustic performance gap analysis, demographic disparity scoring · Stack: Leaflet
View project
Tracks pharmacy closures across Ohio (2019–2024) to identify medication access deserts and vulnerable populations, with drive-time analysis and a diabetes/elderly vulnerability index.
Data: NPPES pharmacy registry, ACS diabetes/elderly estimates · Method: Drive-time analysis, vulnerability indexing · Stack: Leaflet, Chart.js
View project
Examines how polling place closures in Georgia (2020–2024) created disparate voter access burdens, measuring distance equity gaps by race and income using network-based calculations.
Data: OSM, Census 2020, ACS · Method: Network-based distance calculations, demographic disparity analysis · Stack: Leaflet
View project
Interactive tool identifying 16,805 high-hazard US dams with downstream flood risk estimates using structural risk scoring and Froehlich breach discharge modeling across 92,445 dams.
Data: USACE National Inventory of Dams 2026 · Method: Froehlich (1995) breach equation, 4-factor composite risk score · Stack: Leaflet, GeoJSON
View project
Interactive map of EPA-regulated industrial facilities releasing toxic chemicals near Texas public schools and daycares, with wind-adjusted exposure risk rankings.
Data: EPA TRI, NOAA weather stations, TEA school locations · Method: Proximity analysis, wind direction weighting · Stack: MapLibre, Turf.js, Python/GeoPandas
View project
Interactive visualization of 185,000+ fatal US traffic collisions (2019–2023), filterable by year, crash type, road type, and location setting using NHTSA FARS data.
Data: NHTSA FARS 2019–2023 (185k records) · Method: Density viz & temporal filtering
View project
Analyzes tree canopy coverage gaps along school walking routes in Austin, TX to map shade equity disparities against demographic data.
Data: ACS 2022, OSMnx pedestrian network, i-Tree canopy · Method: Network gap analysis
View project
Tests the contagion hypothesis that property abandonment in Detroit spreads spatially to neighboring parcels, using spatial autocorrelation and predictive modeling.
Data: Detroit parcel vacancy records · Method: Moran’s I, LISA spatial autocorrelation
View project
Nationwide blackout vulnerability index across 3,144 US counties, combining grid reliability, weather hazards, demographic risk, and FEMA NRI data into a weighted composite score.
Data: EIA-861/860, FEMA NRI v1.20, Census ACS · Method: 5-factor weighted composite index
View project
Spatial analysis of Detroit 911 call data examining whether police response times correlate with neighborhood race and income using OLS regression.
Data: Detroit CAD 911 records, ACS, TIGER/Line · Method: OLS regression, spatial join
View project
Composite risk scoring across 617,597 US highway bridges using FHWA inspection data — weighting structural condition, traffic exposure, age, detour impact, and scour vulnerability.
Data: FHWA NBI 2023 (617k bridges) · Method: 5-factor composite risk score
View project
National analysis of ~67,000 public elementary schools modeled against WHO cognitive development thresholds, examining whether low-income communities face disproportionate highway noise impacts.
Data: NCES EDGE 2023, Census TIGER · Method: ISO 9613-2 acoustic attenuation model
View project
Interactive risk model identifying regions most vulnerable to climate-driven displacement by combining temperature anomalies, sea level rise, drought indices, and socioeconomic factors to forecast migration pressure hotspots.
Data: NASA CMIP6, FEMA, Census ACS · Method: Multi-factor weighted displacement index
View project
Interactive map of Harris County leaking underground storage tank sites integrating soil, groundwater, and TCEQ registry data to score contamination risk to drinking water wells and prioritize remediation.
Data: EPA HIFLD, Census ACS · Method: Proximity analysis, environmental justice scoring
View project
Tracks artificial radiance changes across Colorado's Front Range from 2012–2024 using satellite night-lights data, identifying development impacts on wildlife corridors and dark sky preservation areas.
Data: VIIRS DNB VNL v2.1, PAD-US 3.0, NLCD · Method: Raster change detection 2012–2024
View project
Maps transit deserts and commuter accessibility disparities, revealing where low-income workers face the greatest mismatch between residential location and job centers.
Data: GTFS transit feeds, Census ACS · Method: Network accessibility gap analysis
View project
Identifies tornado warning dead zones in the Moore/Norman/OKC region where sound levels fall below 70 dB, pinpointing 2,236 km² of inadequate coverage affecting ~246,000 residents.
Data: FCC, Census, USGS DEM · Method: RF signal propagation modeling
View project
Ranks Oakland/Berkeley Hills subdivisions by evacuation vulnerability using road network topology metrics to expose neighborhoods with critically limited egress routes during wildfires or emergencies.
Data: OSM, TIGER/Line, Census ACS · Method: Street network morphology analysis
View project
Examines urban land locked in perpetual non-use by mapping Chicago cemeteries against demographic patterns, transit access, and historical HOLC redlining boundaries to reveal deep spatial inequities.
Data: Cook County parcels, NLCD · Method: Land consumption & temporal change analysis
View project
Maps EMS response time disparities across Dallas–Fort Worth to identify zones where response times exceed cardiac survival thresholds, overlaying heart disease prevalence to quantify mortality risk by geography.
Data: Chicago 911 CAD, Census ACS · Method: Drive-time isochrones, OLS regression
View project
Visualizes combined ground subsidence and sea level rise threatening Houston-Galveston, where localized sinking rates exceed 25 mm/yr, mapping accelerating flood vulnerability across critical coastal infrastructure.
Data: NOAA CO-OPS API, InSAR (U. Houston), SRTM · Method: Relative SLR projection
View project
Transboundary water stress and geopolitical instability analytics using a Water Stress Conflict Index, Random Forest risk classification, spatial autocorrelation, and SSP climate scenario projections.
Data: AQUASTAT, ACLED, GloFAS · Method: NLP conflict extraction, composite risk index
View project
Interactive multi-criteria decision analysis tool ranking Mexican destinations by accessibility, climate comfort, safety, and tourism amenities — with customizable traveler profiles and weighted overlays.
Data: INEGI, USDA, Sentinel-2 · Method: Multi-criteria suitability analysis
View project
Spatiotemporal dashboard forecasting agricultural failure and famine risk using NDVI anomalies, climate stress indices, conflict proximity, and ML-based IPC phase forecasting 6 months ahead.
Data: FAO, MODIS NDVI, FEWS NET · Method: Composite food security early warning index
View project
Urban vegetation intelligence platform tracking greenspace health across Chicago using Sentinel-2 satellite imagery, PostGIS, and AWS Cloud Optimized GeoTIFFs with time-series analysis and degradation flagging.
Data: Sentinel-2, Landsat-8 · Method: NDVI time-series, spectral change detection
View project
Web mapping application for visualizing California wildfire perimeters, modeling fire risk by time of day, and generating dynamic evacuation routes.
Data: USFS, NIFC fire perimeters, NLCD · Method: Multi-factor risk overlay analysis
View project
Interactive tool mapping fixed and mobile broadband coverage gaps across Illinois communities, combining Leaflet mapping with dynamic Chart.js analytics.
Data: FCC Form 477, Census ACS · Method: Coverage gap analysis & equity mapping
View project
IDW interpolation and linear regression exploring links between agricultural nitrate contamination and cancer rates across Wisconsin census tracts.
Data: WGNHS well records, Census ACS · Method: IDW interpolation, spatial regression
View project
Interactive Leaflet map exploring gated communities across Florida with clustering, price-range filtering, and detailed community profiles.
Data: FL county parcel data, Census ACS · Method: Gated community accessibility analysis
View project