A machine learning model that predicts which Chicago properties are likely connected to the water main by a lead service line — to help the city prioritize which pipes to replace first.
When I started this project I was thinking about the lead pipe replacement program that Chicago has been working on and realized that the city has a serious data problem. Chicago is estimated to have somewhere between 400,000 and 800,000 properties still connected to the water main by a lead service line and the reason the range is so wide is because the city does not actually know which properties have them. Lead exposure causes irreversible neurological damage especially in children under six and the reason that matters for this project is that you cannot fix the problem if you do not know where to look first.
The city has records for some known lead service lines but coverage is incomplete and inconsistent across neighborhoods. What I wanted to figure out was whether property characteristics that the city already has on file — things like construction year, building type, and assessed value — could be used to predict which properties are most likely to still have a lead line so that inspectors and replacement crews could be sent to the right places first.
| Dataset | Source | What It Contributes |
|---|---|---|
| Property Assessment Records | Cook County Assessor | Building age, construction class, square footage, assessed value |
| Known Service Line Records | Chicago CDOT / CDWM | Ground-truth labels for confirmed lead and non-lead service lines |
| Water Main Age Data | Chicago Dept. of Water Management | Age and material of the adjacent water main by block |
| Census TIGER/Line | U.S. Census Bureau | Parcel-level spatial boundaries for map rendering |
| Chicago Open Data | City of Chicago Data Portal | Supplemental property attributes and permit history |
The first thing I did was join the Cook County Assessor records to the city's known service line records using parcel IDs and the reason I did that is because I needed labeled examples — properties where the city already knows whether the line is lead or not — to train the model on. I ended up with a labeled dataset of roughly 85,000 properties after filtering out records with missing critical fields.
The features I chose to include were construction year, property class code, building square footage, assessed value per square foot, number of building units, distance to the nearest confirmed lead water main, and water main age on the adjacent block. The reason I included construction year as a feature is because lead service lines were banned from new construction in 1986 so buildings built before that are much more likely to have them. Distance to a known lead main matters because utilities in the same era tended to use the same materials across a whole area.
I chose XGBoost for this and the reason I chose it over a simpler logistic regression is because the relationship between building age and lead probability is not linear — there is a sharp threshold around 1986 — and XGBoost handles those kinds of non-linear patterns much better. I also felt like it was important to be able to look at feature importance after training so I could verify that the model was learning from the right signals and not picking up on something spurious.
I split the data 80/20 for training and testing and used AUC-ROC as my primary evaluation metric and the reason I chose AUC-ROC instead of accuracy is because the classes are imbalanced — there are more non-lead properties than lead ones — and accuracy alone would be misleading. The model achieved 0.87 AUC-ROC on the held-out test set which I was happy with given that the features are all indirect proxies for the actual pipe material.
| Feature | Importance Rank | Why It Matters |
|---|---|---|
| Construction Year | #1 | Pre-1986 construction strongly predicts lead service line presence |
| Distance to Known Lead Main | #2 | Utilities used consistent materials within service areas and eras |
| Water Main Age (Adjacent Block) | #3 | Older mains correlate with older service line materials |
| Property Class Code | #4 | Residential vs. commercial construction followed different plumbing codes |
| Assessed Value per Sq Ft | #5 | Proxy for neighborhood age and renovation history |
When I looked at the model output I could see that construction year before 1986 was the single strongest predictor and that properties built before that threshold were 3.4 times more likely to receive a high-risk prediction than otherwise similar properties built after it.
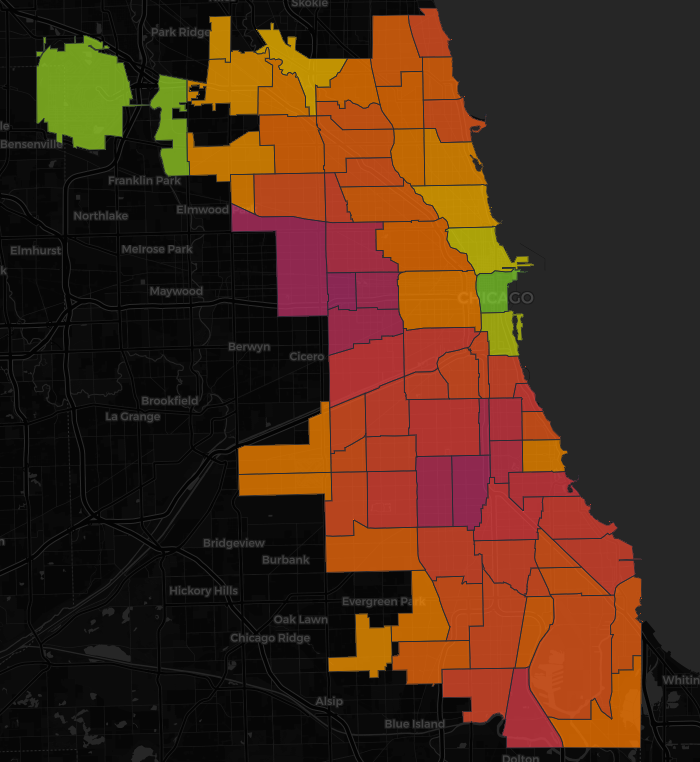
When I mapped the predictions I could see that the highest-probability properties were concentrated on the South Side and West Side of Chicago and the reason that pattern makes sense is because those neighborhoods have older housing stock and older water infrastructure compared to areas that were developed later.
On the held-out test data the model correctly identified 87% of confirmed lead service line properties as high-risk. The reason this matters practically is that if the city used this model to prioritize inspections it would find real lead lines at a much higher rate than random or address-by-address canvassing.
When I applied the model to all Chicago properties without a confirmed service line status I found approximately 112,000 properties receiving a high-risk score and those are the properties I think should be prioritized for physical inspection and testing first.
| Layer | Technology |
|---|---|
| Predictive model | XGBoost (Python), scikit-learn for preprocessing and evaluation |
| Data wrangling | Python (pandas, geopandas, NumPy) |
| Spatial join & export | GeoPandas — parcel join, GeoJSON export |
| Interactive map | Leaflet.js with choropleth and point layers |
| UI & filtering | Vanilla JavaScript, custom risk-tier controls |
| Hosting | GitHub Pages |
The biggest limitation I want to be honest about is that this model is predicting probability based on indirect signals and not directly measuring the pipe material. The reason that matters is that a property with a pre-1986 construction date that scores high-risk might still have had its service line replaced privately and the model has no way of knowing that without access to permit records or replacement logs. A stronger version of this would incorporate building permit data to flag properties where plumbing work has been done after 1986.
If I were to extend this project I would want to work with the city to validate predictions against a random sample of physical inspections so I could measure real-world precision at different probability thresholds. I would also look into adding soil corrosivity data because more corrosive soil accelerates pipe degradation and that could help explain cases where newer pipes have already failed.
What I took away from building this is that machine learning is most useful in a public health context when it is being used to prioritize where to look rather than to replace actual inspection. I feel like that framing is important and I tried to make it clear in the application itself.