A nationwide blackout vulnerability index identifying which of America’s 3,144 counties are most at risk of prolonged power outages — and why.
The 2021 Texas winter storm killed over 240 people and caused $195 billion in damage — largely because the ERCOT grid was unprepared for extreme cold. It was not an isolated event. Between 2000 and 2023, major outages affecting 50,000+ customers have increased by over 60%.
Yet there was no publicly accessible tool mapping where grid vulnerability combines with population vulnerability to create catastrophic risk. Utilities report reliability statistics. FEMA models natural hazard exposure. The Census tracks who is most dependent on electricity. But no one had combined these into a county-level composite risk index — until this project.
| Dataset | Source | What It Measures |
|---|---|---|
| EIA Form 861 | U.S. Energy Information Administration | SAIDI / SAIFI reliability metrics per utility |
| EIA Form 860 | U.S. Energy Information Administration | Power plant locations, fuel type, capacity |
| FEMA NRI v1.20 | FEMA National Risk Index | Natural hazard composite risk by county |
| Census ACS 5-Year | U.S. Census Bureau | Elderly population (65+) share, poverty rate |
| EIA Outage Records | U.S. Energy Information Administration | Historical major outage events 2015–2023 |
Each county receives a Blackout Vulnerability Index (BVI) score from 0–100, computed as a weighted sum of five normalized factors:
| Factor | Weight | Rationale |
|---|---|---|
| Grid Reliability (SAIDI/SAIFI) | 30% | Utilities with high average outage duration/frequency are structurally weaker |
| Weather Hazard Exposure | 25% | Counties exposed to hurricanes, ice storms, and extreme heat face higher grid stress |
| FEMA National Risk Index | 20% | Composite federal risk score incorporates 18 natural hazard types |
| Elderly Population (65+) | 15% | Older residents face greater health risk during outages (medical devices, heat/cold) |
| Poverty Rate | 10% | Low-income households lack resources to cope with extended outages |
All factors were normalized to a 0–1 range using min-max scaling before weighting. Counties were then binned into five risk tiers: Minimal, Low, Moderate, High, and Very High.
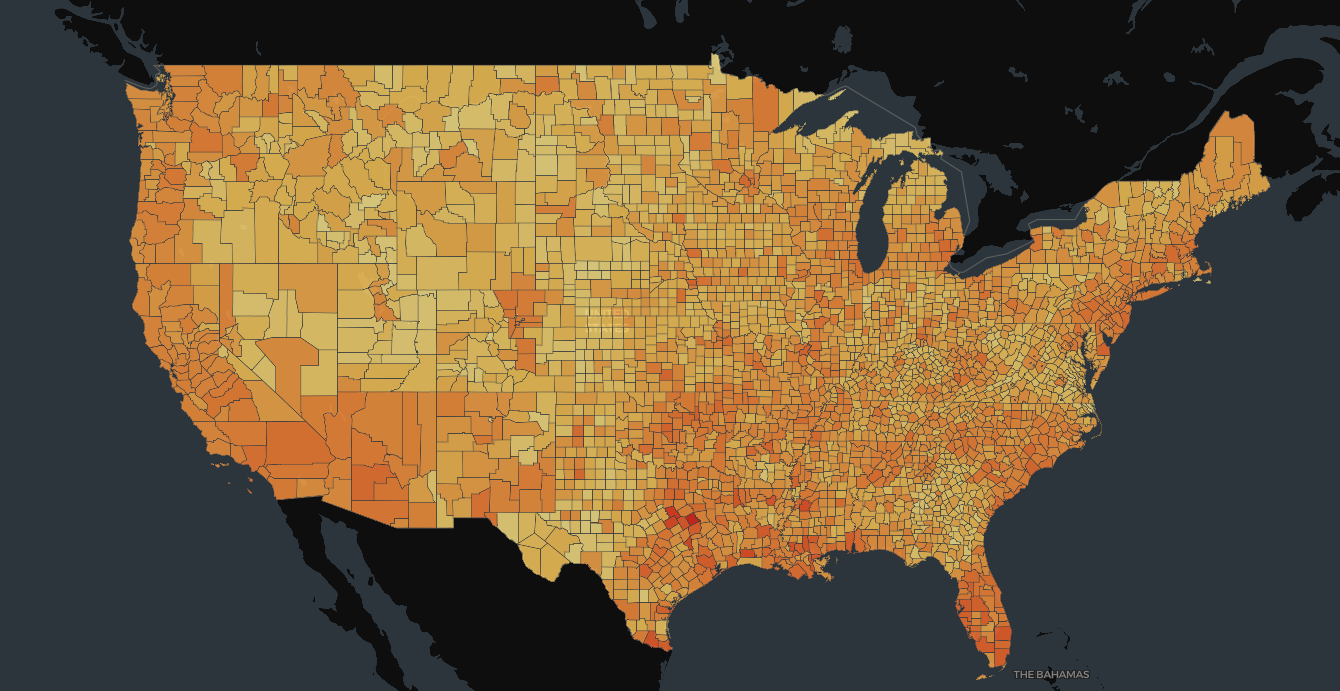
Concentrated in the Gulf Coast, Deep South, Appalachia, and Puerto Rico — regions where aging grid infrastructure meets frequent severe weather and high poverty rates.
One of the things that stood out to me was that Texas scored high across most of the state and the reason for that is the ERCOT grid is isolated from the Eastern and Western Interconnections which means Texas cannot import power during a crisis the way other states can and I feel like that structural weakness is really important to understand.
Counties in the top 10% for elderly population share consistently score 12–18 points higher on BVI than demographically similar counties with younger populations, controlling for hazard exposure.
| Layer | Technology |
|---|---|
| Interactive mapping | Leaflet.js with choropleth layers |
| Data preprocessing | Python (pandas, geopandas, NumPy) |
| Spatial data | GeoJSON county boundaries (Census TIGER/Line) |
| Filtering & UI | Vanilla JavaScript, custom layer controls |
| Hosting | GitHub Pages |
The biggest methodological challenge was reconciling EIA utility service territories with county boundaries — utilities often serve partial counties, requiring area-weighted aggregation of SAIDI/SAIFI metrics. Future improvements would incorporate smart meter penetration rates and transmission line age data from HIFLD for a more granular grid reliability score.
This project demonstrated that combining publicly available government datasets with a transparent, reproducible weighting methodology can produce actionable risk maps that individual datasets alone cannot provide.