A spatial regression analysis testing whether Detroit police response times are longer in neighborhoods with higher proportions of non-white residents and lower incomes — mapping the geography of delayed emergency response.
I chose Detroit for this project because it has a long history of fiscal stress and police department underfunding and I wanted to know whether response times were actually different across neighborhoods or whether that was just perception. The reason I thought this was worth investigating is because response time is one of the most important variables in public safety but you almost never see it mapped at the neighborhood level.
The question I was trying to answer was whether Detroit police response times differ systematically by neighborhood race and income even after you control for call volume. And if they do I wanted to find out which neighborhoods actually wait the longest and by how much.
| Dataset | Source | What It Provides |
|---|---|---|
| Detroit CAD 911 Records | City of Detroit Open Data Portal | Call time, dispatch time, arrival time, priority, location |
| American Community Survey (ACS 5-Year) | U.S. Census Bureau | Race/ethnicity composition, median household income by census tract |
| TIGER/Line Boundaries | U.S. Census Bureau | Detroit census tract geometries for spatial join |
| ArcGIS REST API | ESRI / Detroit GIS | Ancillary spatial data for district boundaries |
The first thing I did was filter the 911 call records to Priority 1 calls only and the reason I did that is because I wanted to control for call urgency so I was only comparing like with like. I calculated response time as the difference between when the call was received and when the officer arrived and I excluded records with incomplete timestamps or geocoding errors.
I then spatially joined the individual calls to Detroit's 139 census tracts using point-in-polygon operations. For each tract I calculated the median response time weighted by call volume and the reason I used median instead of mean is because I did not want a small number of very long waits to skew the results for the whole tract.
I fit an Ordinary Least Squares regression with tract-level median response time as the dependent variable and the reason I chose OLS is because it is interpretable and I could clearly communicate the relationship between each predictor and response time to a non-technical audience. The predictors I used were:
| Variable | Type | Source |
|---|---|---|
| % Non-white residents | Predictor | Census ACS |
| Median household income | Predictor | Census ACS |
| Call volume (calls per 1k residents) | Control | Detroit 911 CAD |
| Distance to nearest precinct | Control | TIGER/Line + Detroit GIS |
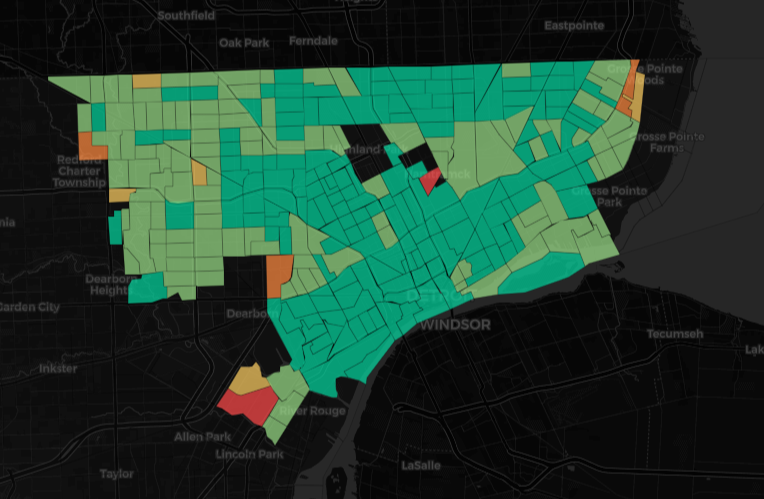
I mapped the regression residuals and predicted response times in Leaflet using a diverging color scale and the reason I chose a diverging scale is because I wanted to make it easy to see which tracts were waiting longer than expected versus shorter than expected based on what the model predicted.
When I looked at the regression output I found that a 10 percentage point increase in non-white tract population was associated with 1.4 additional minutes of response time on average holding income and call volume constant and the reason this finding matters is because it persists even after controlling for the other variables.
What surprised me was that the income effect was actually stronger than the race effect. A $10,000 decrease in median household income was associated with 2.1 additional minutes of response time which made it the largest single predictor in the model after I controlled for precinct distance.
When I mapped the results I could see that the 15 tracts with the longest predicted response times averaging 18 or more minutes were all clustered in the northeast corner of the city. The reason those tracts score so high is because they have high poverty rates and low population density and they are farther from precinct locations all at the same time.
| Layer | Technology |
|---|---|
| Interactive mapping | Leaflet.js with choropleth + marker layers |
| Data collection | ArcGIS REST API (Python requests) |
| Statistical analysis | Python (statsmodels OLS, geopandas, pandas) |
| Spatial join | Geopandas point-in-polygon |
| Boundary data | Census TIGER/Line via Census API |
| Hosting | GitHub Pages |
One thing I want to be clear about is that this analysis is cross-sectional which means I cannot prove causation. The longer response times I found in lower-income and higher non-white tracts could reflect patrol allocation decisions or officer deployment patterns or geographic constraints rather than anything intentional and I think it is important to be upfront about that limitation.
If I were to continue this project I would apply spatial lag and spatial error regression models to account for the fact that response times in adjacent tracts are probably correlated with each other. I would also want to extend the analysis to other Michigan cities to give the Detroit findings more context and see whether the patterns I found hold elsewhere.